Retail Media Planning
Part of Retail display and branded spaces
Comparing category-page placements with store homepage exposure
Compare retailer category-page and homepage placements by shopping context, actual format, destination and reporting.
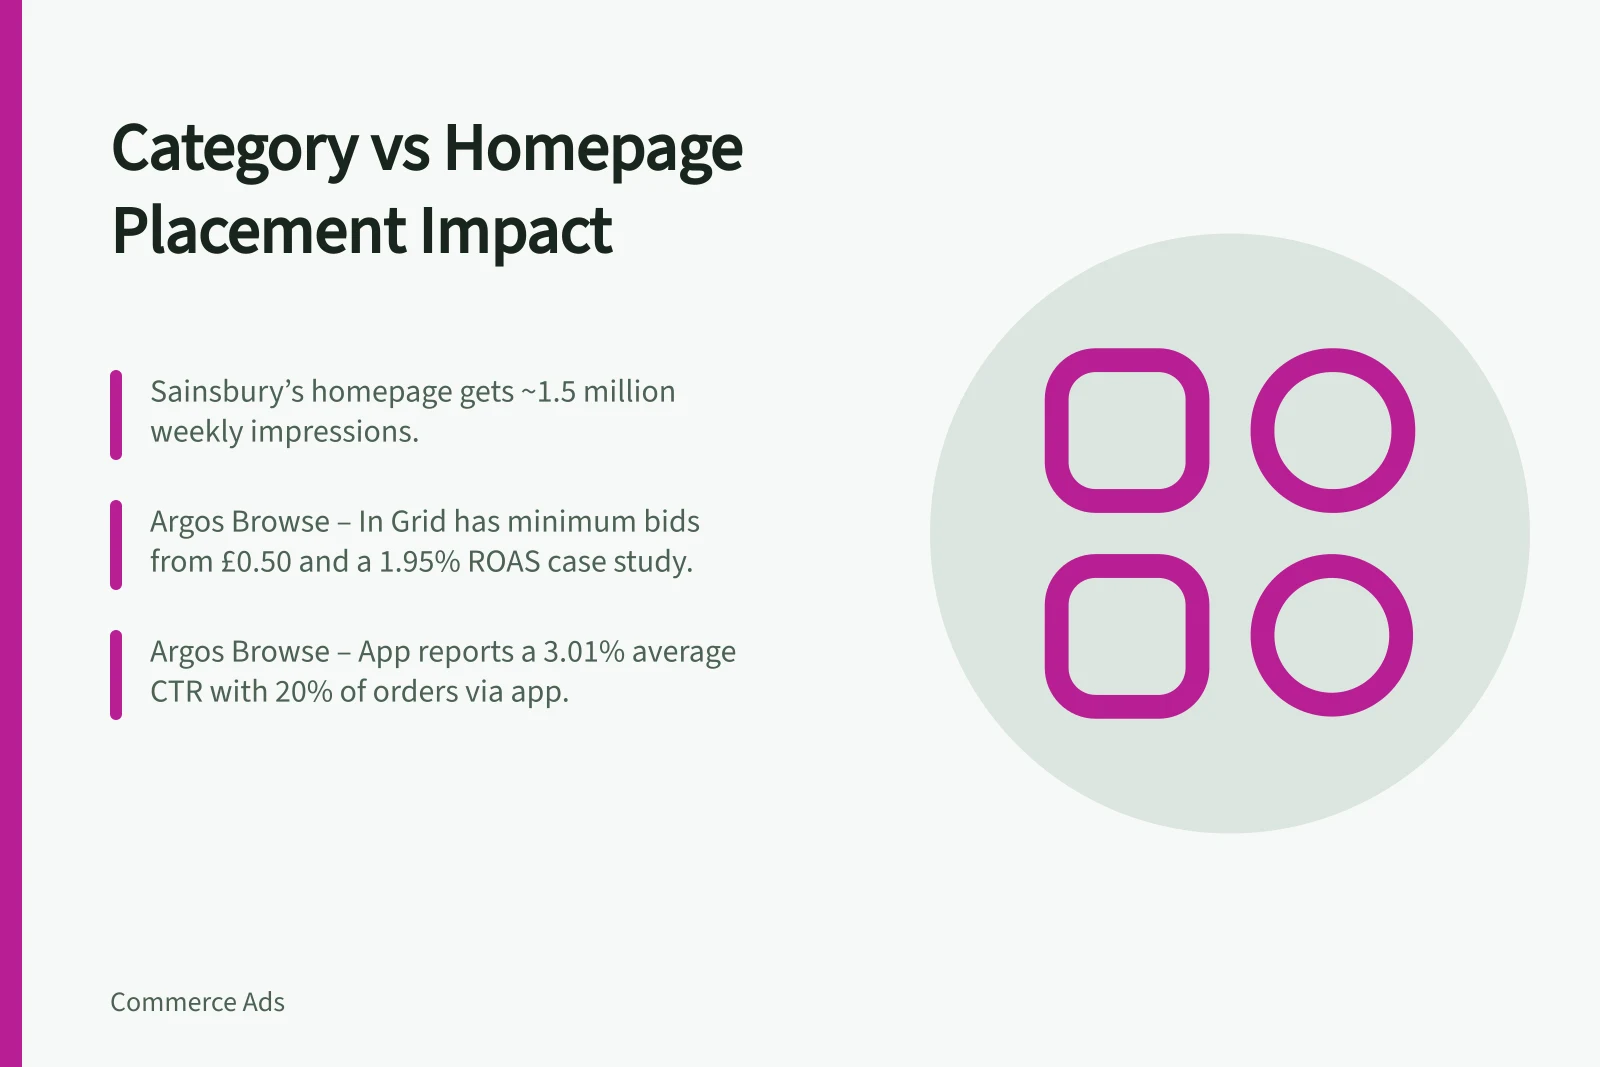
Category placements meet shoppers within a product group; homepage placements appear earlier in the store journey. Sainsbury’s and Argos both list Browse – In Grid, while their homepage formats differ: Sainsbury’s reports around 1.5 million weekly homepage impressions, and Argos Homepage – Web offers a carousel of up to 10 SKUs.
What each page reveals
A category page gives a defined product-group context but does not establish brand preference. A homepage gives less category context and can introduce a product range before the shopper narrows the trip.
Sainsbury’s Browse – In Grid places sponsored products within a specific product category. It uses CPC, with minimum bids from £0.45, and reports an average case-study ROAS of 255%*.
Argos Browse – In Grid also places sponsored products within a specific product category. Minimum bids start at £0.50, and the reported average case-study ROAS is 1.95%*.
Argos Browse – App places sponsored products under relevant product categories and mirrors Browse In Grid, with minimum bids from £0.50. Around 20% of Argos customer orders are placed via the app; the placement reports an average case-study CTR of 3.01%*.
Sainsbury’s Sponsored Products Homepage – Web highlights products and reports around 1.5 million weekly homepage impressions. It uses CPC, with a minimum starting bid of £0.45, and campaigns may also appear automatically in the Sainsbury’s App for iOS and Android.
Argos Homepage – Web displays up to 10 selected SKUs in a carousel and may be seen by every user accessing the Argos website. It uses CPC, with minimum bids from £0.50; Argos Homepage – App mirrors the web experience, with a minimum starting bid of £0.45.
Sainsbury’s vs Argos: Category-Page and Homepage Placements Comparison
- Placement Type
- Browse – In Grid (Category Page)
- Retailer
- Sainsbury’s
- Bidding Model
- CPC
- Minimum Bid
- £0.45
- Average ROAS (Case Study)
- 255%
- Placement Type
- Browse – In Grid (Category Page)
- Retailer
- Argos
- Bidding Model
- CPC
- Minimum Bid
- £0.50
- Average ROAS (Case Study)
- 1.95%
- Placement Type
- Homepage – Web (Carousel)
- Retailer
- Argos
- Bidding Model
- CPC
- Minimum Bid
- £0.50
- SKUs in Carousel
- Up to 10
- Placement Type
- Sponsored Products Homepage – Web
- Retailer
- Sainsbury’s
- Weekly Impressions
- Approx. 1.5 million
- Bidding Model
- CPC
- Minimum Bid
- £0.45
Compare like with like
Page position alone does not predict results. Confirm eligible pages, placement position, devices, targeting, buying basis, creative specification and permitted destinations; check whether a web booking also covers the app.
For category inventory, identify the retailer’s actual product grouping, which may differ from the brand’s range structure. Check that advertised items are available and that the destination shows the promised range or variant, since a mismatch can weaken either placement and the comparison.
Pre-Comparison Checklist for Retailer Placements
- Confirm eligible pages and placement positions
- Verify devices covered (web, app, or both)
- Check targeting parameters and buying basis (CPC, etc.)
- Review creative specifications and permitted destinations
- Ensure web booking includes app coverage if applicable
- Validate product grouping matches retailer's actual structure
- Confirm advertised items are available and destination is accurate
Read the results carefully
The reported Browse – In Grid case-study averages are 255%* ROAS for Sainsbury’s and 1.95%* ROAS for Argos. These are separate case-study figures, not a like-for-like result; Argos Browse – App reports a 3.01%* average CTR, a different metric and placement.
Request impressions, viewability where available, clicks and destination visits for each placement. Where available, report display viewability separately alongside impressions.
Where retailers provide them, compare relevant product-page visits after the click. Keep the reporting period and product set consistent, and record gaps in available metrics.
A difference in click rate could reflect the message, format, targeting or page context. Use the results to inform the next booking decision without attributing a difference to a factor the comparison cannot isolate.
Key Performance Metrics by Placement
- 255%Sainsbury’s Browse – In Grid ROAS (Case Study)
- 1.95%Argos Browse – In Grid ROAS (Case Study)
- 3.01%Argos Browse – App CTR (Case Study)
- 1.5Sainsbury’s Homepage Weekly Impressions